Welcome to WaterViz!
A Water Cycle Visualization Tool
At the Hubbard Brook Experimental Forest
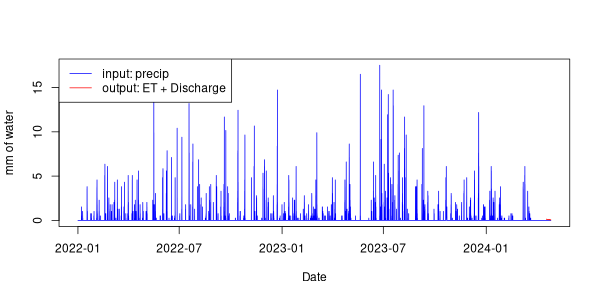
Live-streaming data power this animation. WaterViz accurately reflects water moving through a small forested watershed in New Hampshire, in near real-time.
NEW!! WaterViz 2.0!
WaterViz Radio Station
Now Playing Most Current Hour of Water Cycle Data!
Current Conditions
The data that drive WaterViz come from a variety of sensors installed at Hubbard Brook.
An hourly processing routine gathers data from the different sensor files, merges these data, and updates the WaterViz database. More than a dozen measurements are used for WaterViz and related data visualization and sonification.
This table shows the most recent hour of data available.
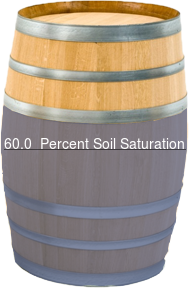
Soil Water Content
Water Flux